AI for data and measurement: analytics, charts and reports
Using AI to analyse data, build reports and measure results: from a falling chart to your own visualisation and testing a model on a spreadsheet.
Where to start
Start with the article on a dropping chart, then build your own chart from data. If you work with spreadsheets and reports, see how GPT-6 Astra handles them.
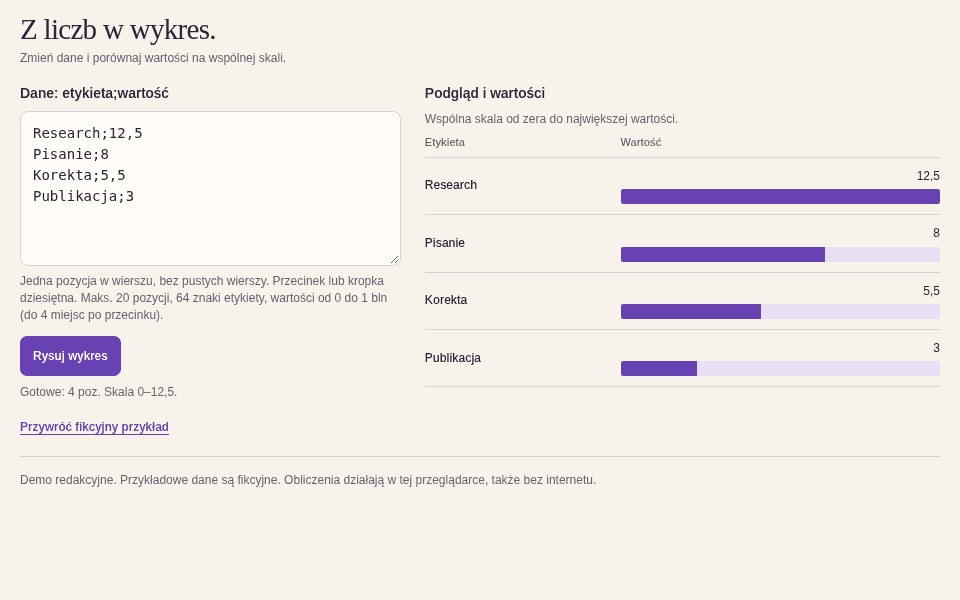
Two almost equal numbers, visibly different bars. We found that bug in our own chart editor. Here is the fix, along with the entire HTML file for you to use.
A large context window sounds impressive. What can you do with it? We suggest three tasks for Astra: untangling documents, an editable budget and a search feature you can run.
Sales fell. But why? AI can help inspect data and find a lead, but first we need to check the numbers. Start with one question, rather than the promise of an automatic report.